Annual Report key figures
| Key figures | ||||||
| Business development (in € million) | 2024 | 2023 | 2022 | 2021 | 2020 | |
|---|---|---|---|---|---|---|
| Revenue | 3,429.0 | 3,139.3 | 2,863.3 | 2,667.3 | 2,486.0 | |
| Personnel expenses | 2,056.1 | 1,875.9 | 1,734.1 | 1,630.5 | 1,542.9 | |
| Cash flow from operating activities | 361.3 | 369.6 | 292.7 | 342.7 | 417.1 | |
| Free cash flow1 | 201.9 | 186.9 | 150.1 | 228.1 | 302.4 | |
| Capital expenditures | 150.5 | 180.5 | 153.8 | 106.3 | 110.7 | |
| EBIT2 | 216.6 | 217.7 | 195.0 | 225.2 | 172.0 | |
| Income before taxes | 225.0 | 225.1 | 182.7 | 215.1 | 158.2 | |
| Consolidated net income | 159.9 | 176.8 | 132.6 | 154.5 | 111.0 | |
| ROCE | in % | 10.1 | 11.5 | |||
| EBIT margin | in % | 6.3 | 6.9 | 6.8 | 8.4 | 6.9 |
| EBIT margin, adjusted | in % | 6.9 | 7.6 | 7.7 | 8.8 | 8.3 |
| EBT margin | in % | 6.6 | 7.2 | 6.4 | 8.1 | 6.4 |
| EBT margin, adjusted | in % | 7.1 | 7.9 | 7.1 | 8.4 | 7.8 |
| Assets | ||||||
| Non-current assets | 2,383.8 | 1,961.7 | 1,970.0 | 1,722.3 | 1,692.4 | |
| Current assets | 1,199.5 | 1,339.5 | 1,103.9 | 945.0 | 926.4 | |
| Total assets | 3,583.3 | 3,301.2 | 3,073.9 | 2,667.3 | 2,618.8 | |
| Equity ratio | in % | 54.7 | 54.7 | 54.6 | 48.2 | 36.5 |
| Employees | ||||||
| Full-time equivalents (annual average) | 26,529 | 25,023 | 23,957 | 23,220 | 22,803 | |
| Headcount | ||||||
| As of December 31 | 29,989 | 27,905 | 26,595 | 25,538 | 25,196 |
The 3 most important key figures
3,429.0
150.5
225.0
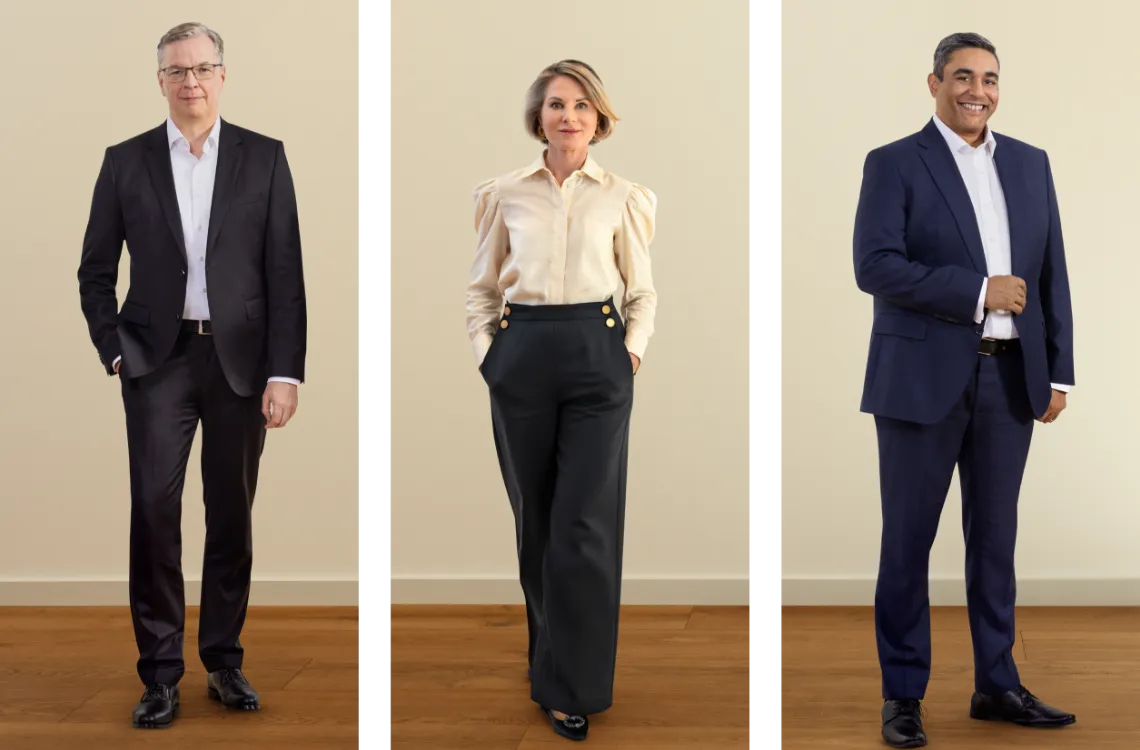
Message from the Board of Management
Thanks to our business performance and our forward-looking projects, we are confident about the future and well equipped for the years to come. Read more in the detailed foreword to the report.
Annual Report 2024
You can view and download the full annual report here.